6 FACTS ABOUT ASCENT OF APOLLO 11
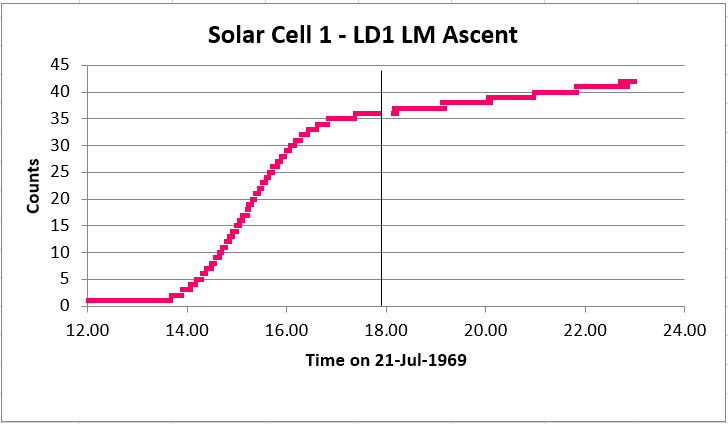
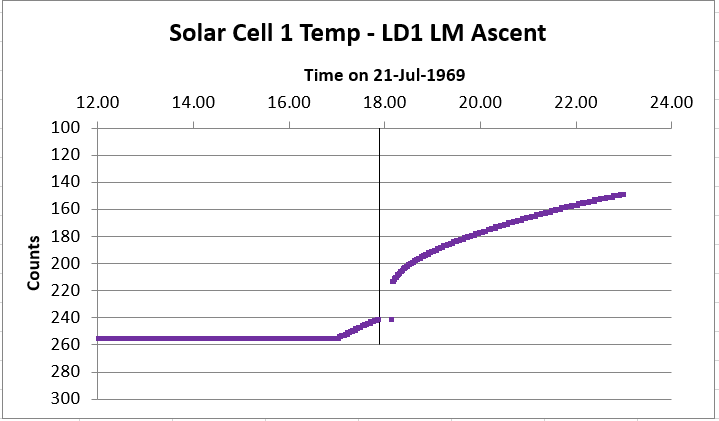
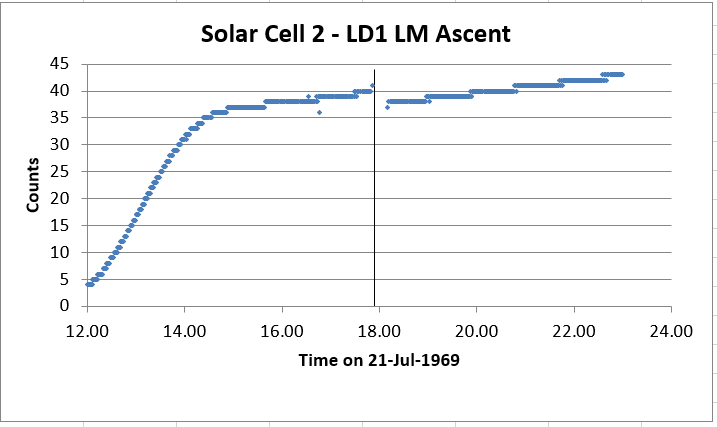
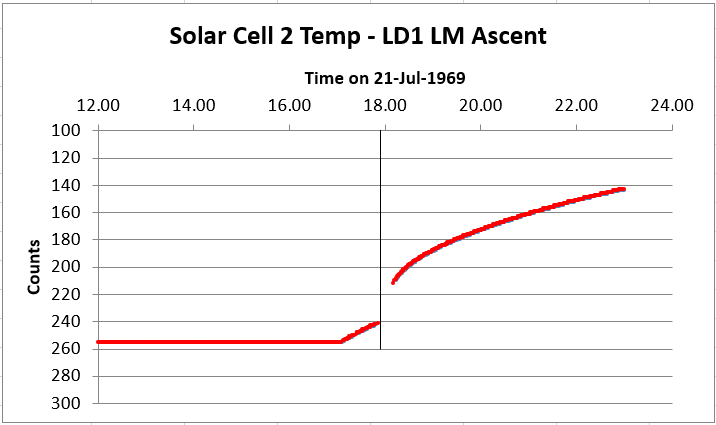
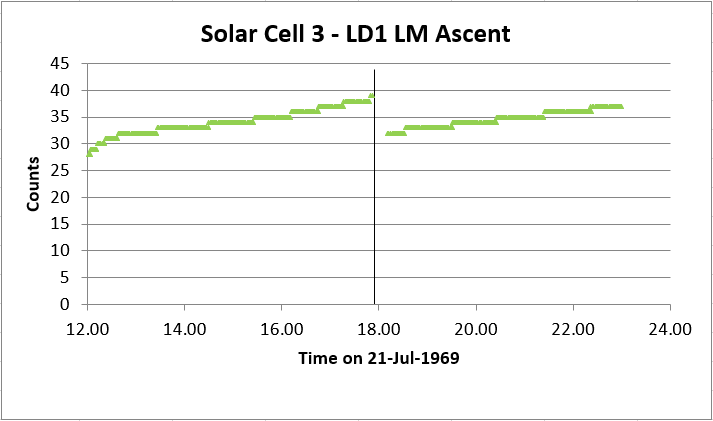
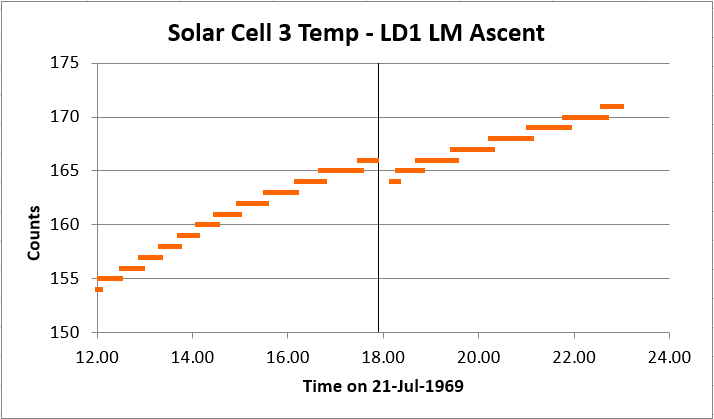
Here we show the measurements made by all 3 solar cells and all 3 thermometers of the Apollo 11 Dust Detector Experiment (DDE) during the ascent of Apollo 11 Lunar Module on 21 July 1969. EASEP was deployed only 17m from the Apollo 11 LM.
Buzz tried to reduce the effects by partly sheltering EASEP behind the largest rock in the vicinity.
This is the first publication of the dust and temperature effects caused by the first rocket ascent carrying men from the Moon.
These large effects led to the Apollo 12 ALSEP package being deployed 130m from its Lunar Module.
Click to Enlarge.
1 FACT AND 1 EXPLANATION OF ERROR
The measurements of changes in 2 of 3 solar cells of the Apollo 11 DDE published by O'Brien et al. (1970) are correct. A natural question is what were the measurements plotted in Fig.10-3 and 10-4 of the NASA Apollo 11 Preliminary Science Report SP-214.
Here we show the simple answer, that Fig.10-3 plotted measurements made in August, 1969, a month after the LM ascent in July.
The correct chart (left) here shows a gap in telemetry during the ascent of Apollo 11 LM, caused by loss of signal through the plasma cloud of the rocket exhaust.
The correct chart shows that Cell 2 (blue) and Cell 3 (green) both decreased during LM ascent.
By comparison, there was no such gap in the August chart. Figure 10-3 of SP-214, by plotting once every 10 hours then joining each pair of points with straight lines, could not show either the loss of signal or anything else that occurred in the few seconds of the LM Ascent. Yet the NASA August 8 report by Bates alone reported (from Bendix charts) large changes in two cells. The Bates report concluded that it was unlikely that the dust would have any fine structure to cause this effect, yet the movies of horizontal sheets of dust viewed through Armstrong's window showed continuous changes in such fine structure.
Further conclusive evidence that SP-214 Fig.10-3 plotted August measurements not July is seen by comparing the blue line (Cell #2) with the Green line (Cell #3) in the two charts.
To complete this issue, Fig.10-3 could not be plotting measurements from another Lunar Day, because the EASEP system had been so overheated by the dust it received that it failed before noon on Lunar Day 2, in August.