MEASUREMENTS OF DUST: APOLLO 11 LM ASCENT
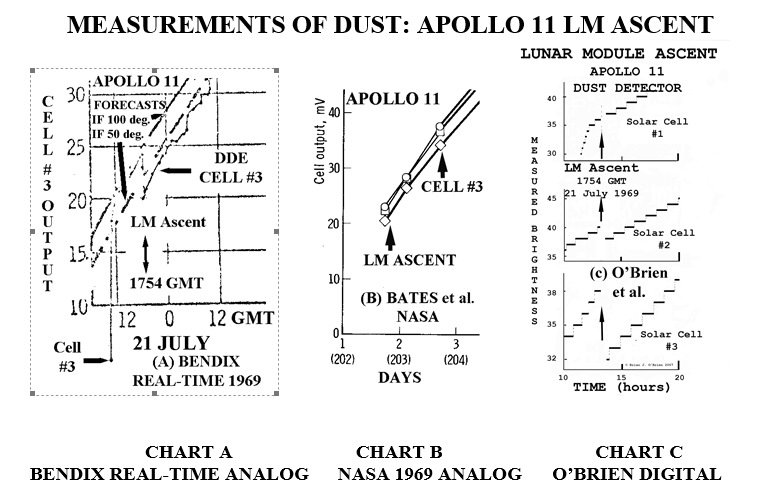
FIGURE 3: Three 1969-70 charts of Apollo 11 Dust Detector Experiment (DDE) measurements of the dust effects from the ascent of the Lunar Module (LM) from Bendix Aerospace, Bates et al., 1970 in the NASA Apollo 11 Preliminary Report and O’Brien et al., 1970. Upwards trends are caused by Sun rising in the sky during early morning. Temperatures were also plotted but not analysed by Bendix and in Figure 10-4 of Bates et al. (1969). Temperatures were not plotted by O’Brien et al. (1970) because of confusion in 1969-70 about sources of temperature data in the modified Apollo 11 DDE.
(CHART A) Bendix real-time analogue chart of Solar Cell #3 output. Bendix was part of the real-time support staff in MSC Mission Control Center, so its on-line chart includes predicted Cell #3 outputs for temperatures of 100C and 50C. The sharply-rising output at the start is caused by initial shadowing by the Eastern panel of solar cells powering EASEP, shown later by Cell #2 with about an hour delay and then by Cell #1 with a comparable delay, while the general increase then follows as the sun rises during the morning of 21 July 1969. A sharp decrease of Cell #3 of about 17% at LM ascent is clear. The quality of these personal archival photocopies of Bendix plots was degraded by time, so some segments were deleted but none added using PhotoShop for clarity in publication.
(CHART B) Bates et al., 1969 report in NASA Apollo Preliminary Science Report (PSR), with analogue data from each of the 3 solar cells plotted every 10 hours, and straight lines joining each pair of successive dot points. LM ascent occurred about 25 minutes after the first plotted points and 9 hours before the second plotted points. Straight lines joined dots. No telemetry fade is shown. This and its companion Figure 10-4 of two temperatures were the only NASA charts published during the Apollo era as evidence for embedded claims there was no significant contamination by dust on the DDE at Apollo 11 LM ascent. In reality, as shown in charts below, the measurements in Figures 10-3 and 10-4 in NASA SP-214 were made in August, a month after Apollo 11 Lunar Module with Armstrong and Aldrin had left the Moon. (See more on this issue here)
(CHART C) O’Brien et al., 1970 digital plots of Cell #3 measurements every 54 seconds taken from PI tape#25321 in 1969. Cell #1 (bare) showed no effect, while cell #2 (cover of 0.15mm) showed a decrease of 7% and cell #3 (cover 0.5mm) decreased by 17%. Time resolution is more than 600 times higher than that plotted in Bates et al., 1969 in the NASA Apollo 11 PSR. This joint paper was prepared by the two scientists O’Brien in Sydney and Freden in Houston exchanging drafts between November 1969 and May 1970, when their joint paper was accepted for publication (O’Brien et al., 1970).
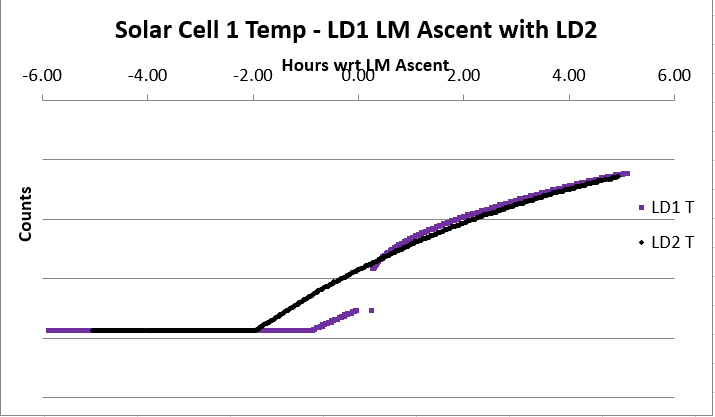
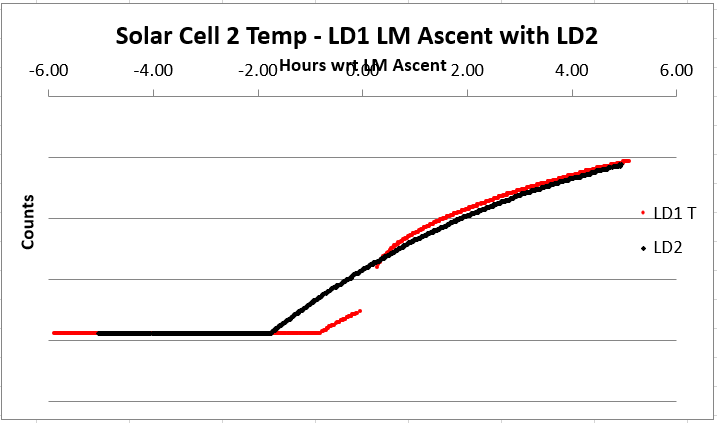
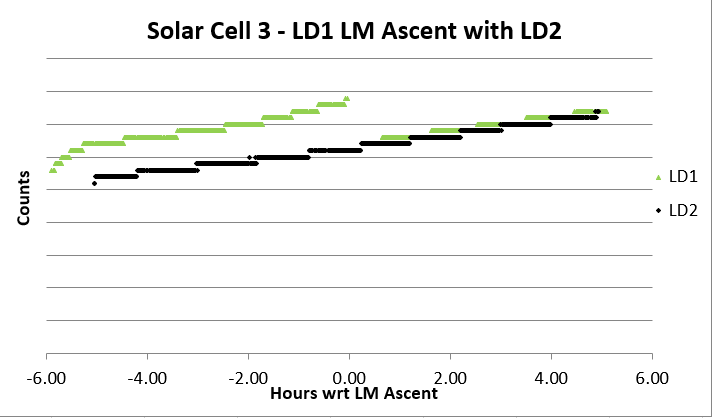
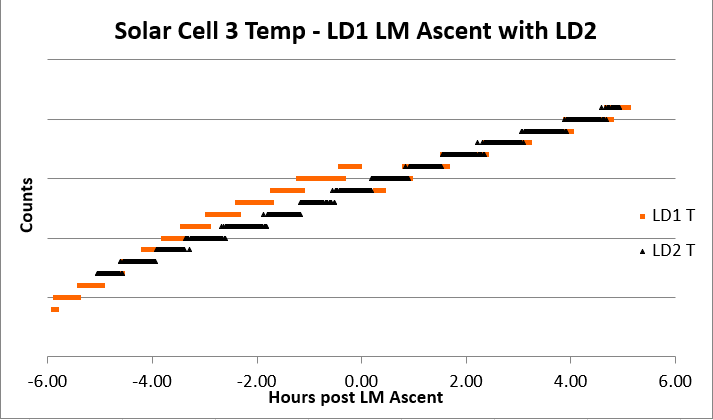
Comparisons of each of the 6 Apollo 11 sensors for the July 21 Lunar Module ascent with measurements taken a month later.